Quick Start Guide
Get Product-FARM up and running in 5 minutes, then learn how to build your first rule engine product step-by-step.
Part 0: Environment Setup
Before you begin, you need to install the required dependencies. This section provides step-by-step installation instructions.
Prerequisites Overview
| Requirement | Version | Purpose |
|---|---|---|
| Rust | 1.75+ | Backend API server |
| Node.js | 20+ | Frontend development |
| DGraph | 24.0+ | Graph database |
| Git | 2.0+ | Version control |
Install Rust
Rust is required to build and run the backend API server.
Linux / macOS:
# Install Rust using rustup (official installer)
curl --proto '=https' --tlsv1.2 -sSf https://sh.rustup.rs | sh

# Follow the prompts (default installation is recommended)
# Then reload your shell configuration
source $HOME/.cargo/env

# Verify installation
rustc --version
# Expected output: rustc 1.75.0 or higher

# Update to latest stable (if already installed)
rustup update stable
Windows:
# Download and run rustup-init.exe from https://rustup.rs
# Or use winget:
winget install Rustlang.Rustup

# Verify installation
rustc --version
Install Node.js
Node.js is required for the frontend application.
Using nvm (Recommended for Linux/macOS):
# Install nvm (Node Version Manager)
curl -o- https://raw.githubusercontent.com/nvm-sh/nvm/v0.39.7/install.sh | bash

# Reload shell configuration
source ~/.bashrc  # or ~/.zshrc for Zsh

# Install Node.js 20 LTS
nvm install 20
nvm use 20
nvm alias default 20

# Verify installation
node --version
# Expected output: v20.x.x

npm --version
# Expected output: 10.x.x
Using Package Manager:
# Ubuntu/Debian
curl -fsSL https://deb.nodesource.com/setup_20.x | sudo -E bash -
sudo apt-get install -y nodejs

# macOS (using Homebrew)
brew install node@20

# Windows (using winget)
winget install OpenJS.NodeJS.LTS
Install DGraph
DGraph is the graph database that stores all product configurations.
Option 1: Direct Installation (Linux/macOS)
# Download and install DGraph
curl -sSL https://get.dgraph.io | bash

# Verify installation
dgraph version
Option 2: Using Docker (Recommended for Development)
# Pull the DGraph image
docker pull dgraph/dgraph:latest

# Or use docker-compose (included in the repository)
# The start-all.sh script handles this automatically
Option 3: Manual Download
# Linux (amd64)
wget https://github.com/dgraph-io/dgraph/releases/download/v24.0.0/dgraph-linux-amd64.tar.gz
tar -xzf dgraph-linux-amd64.tar.gz
sudo mv dgraph /usr/local/bin/

# macOS (using Homebrew)
brew install dgraph
Verify All Prerequisites
Run these commands to verify everything is installed correctly:
# Check Rust
rustc --version && cargo --version
# ✓ rustc 1.75.0+ and cargo 1.75.0+

# Check Node.js
node --version && npm --version
# ✓ v20.x.x and 10.x.x

# Check DGraph (if installed directly)
dgraph version
# ✓ Dgraph version v24.x.x

# Check Git
git --version
# ✓ git version 2.x.x
Troubleshooting Prerequisites
Rust Issues:
# If cargo command not found, add to PATH:
export PATH="$HOME/.cargo/bin:$PATH"

# If build fails, ensure you have build essentials:
# Ubuntu/Debian:
sudo apt-get install build-essential pkg-config libssl-dev

# macOS:
xcode-select --install
Node.js Issues:
# If nvm command not found, add to shell profile:
export NVM_DIR="$HOME/.nvm"
[ -s "$NVM_DIR/nvm.sh" ] && \. "$NVM_DIR/nvm.sh"

# If npm permissions error:
mkdir ~/.npm-global
npm config set prefix '~/.npm-global'
export PATH=~/.npm-global/bin:$PATH
DGraph Issues:
# If DGraph fails to start, check port availability:
lsof -i :5080  # Zero node
lsof -i :8080  # Alpha HTTP
lsof -i :9080  # Alpha gRPC

# Clear DGraph data if corrupted:
rm -rf infrastructure/dgraph-data/*
Part 1: Clone and Start Services
Step 1: Clone the Repository
git clone https://github.com/ayushmaanbhav/product-farm.git
cd product-farm
Step 2: Start All Services
The easiest way to get started is using the all-in-one start script:
./start-all.sh
This script will start:
- DGraph Zero (cluster management) on port 5080
- DGraph Alpha (database) on ports 7080, 8080, 9080
- Backend REST API on port 8081
- Frontend on port 5173
What happens during startup:
[Starting DGraph Zero...]        ✓ Port 5080
[Starting DGraph Alpha...]       ✓ Ports 7080, 8080, 9080
[Building Backend...]            ✓ Compiling Rust (first run takes 2-3 min)
[Starting Backend API...]        ✓ Port 8081
[Installing Frontend deps...]    ✓ npm install
[Starting Frontend...]           ✓ Port 5173

All services started successfully!
Frontend: http://localhost:5173
API:      http://localhost:8081
Step 3: Open the Dashboard
Navigate to http://localhost:5173 in your browser. You’ll see the Product-FARM dashboard:
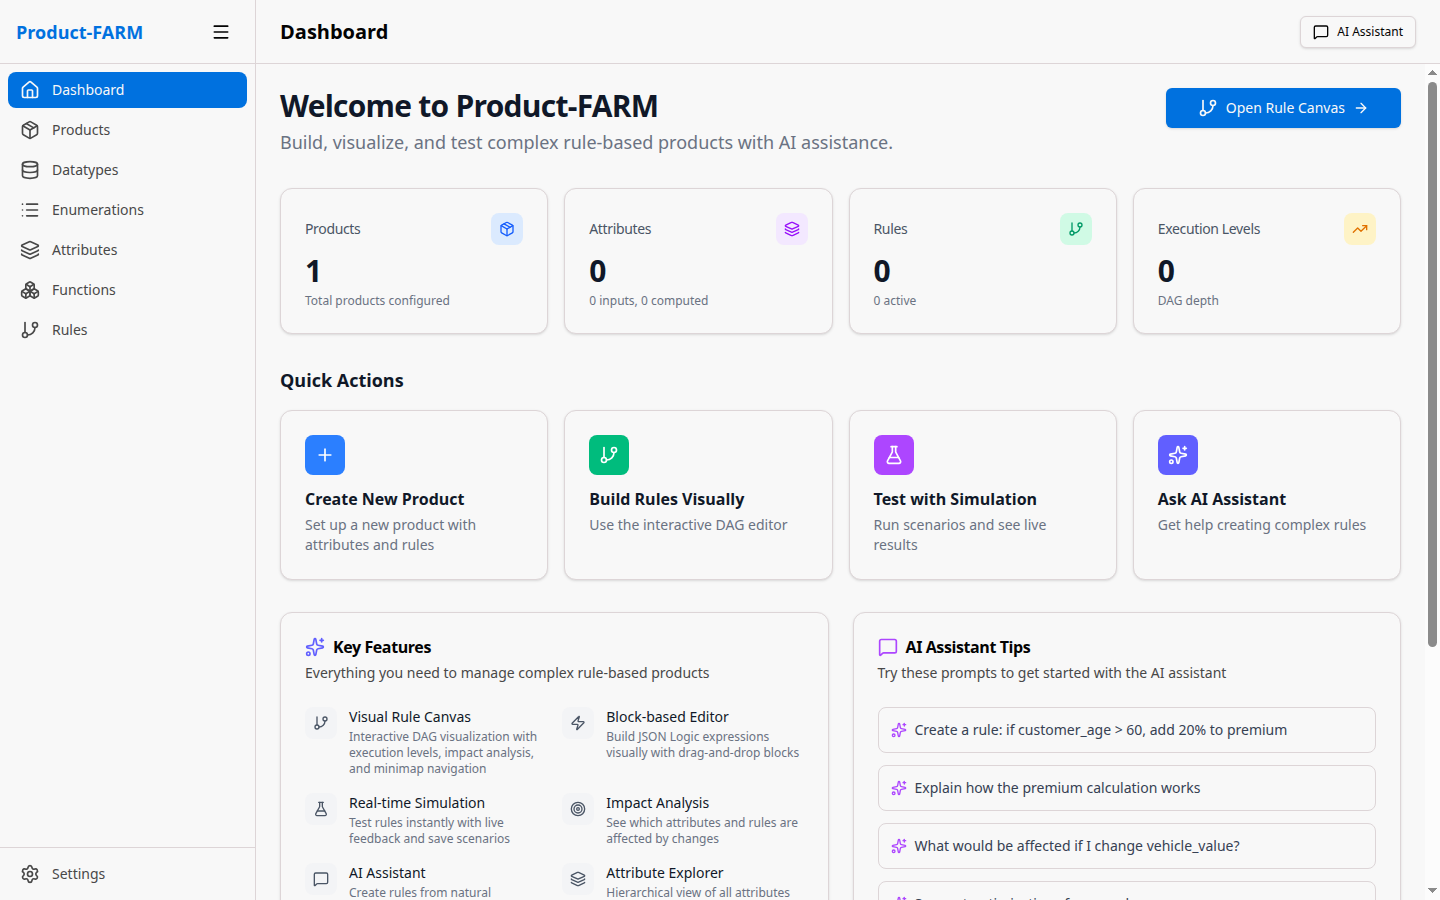
The dashboard provides quick access to all components and shows your recent activity.
Step 4: Verify Services
Verify all services are running correctly:
# Check API health
curl http://localhost:8081/health
# Expected: {"status":"healthy"}

# Check DGraph
curl http://localhost:8080/health
# Expected: {"status":"healthy"}

# Check frontend (should return HTML)
curl -I http://localhost:5173
# Expected: HTTP/1.1 200 OK
Part 2: Create Custom Datatypes
Datatypes define the structure and validation for your data. Let’s create custom datatypes for our insurance product.
2.1 Navigate to Datatypes
Click “Datatypes” in the left sidebar to see the datatypes management page:

2.2 Create a Currency Datatype
Click the ”+ New Datatype” button to open the creation dialog:
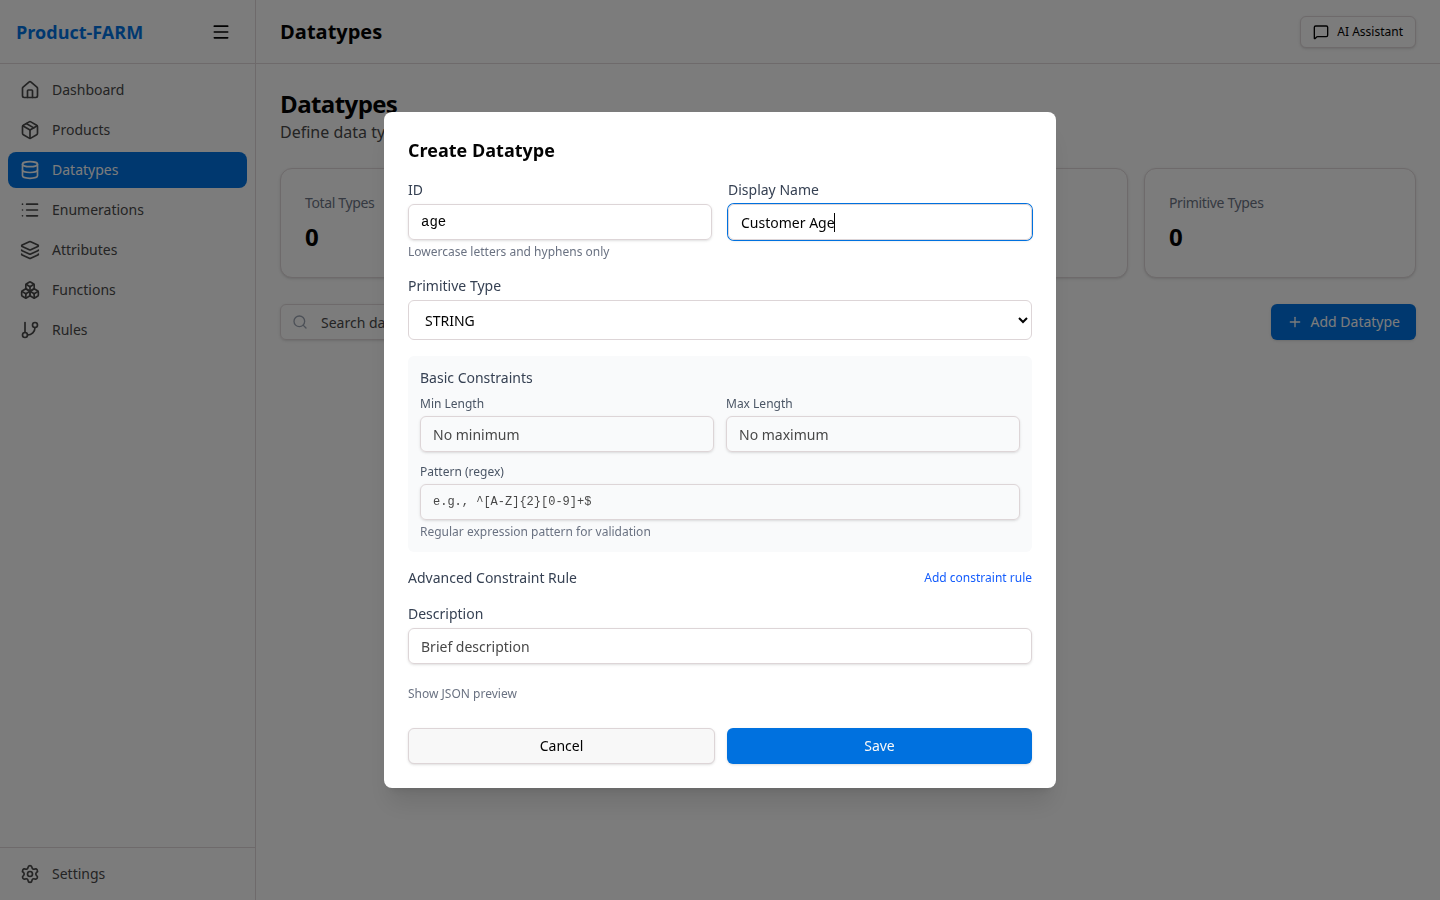
Fill in the details for a currency datatype:
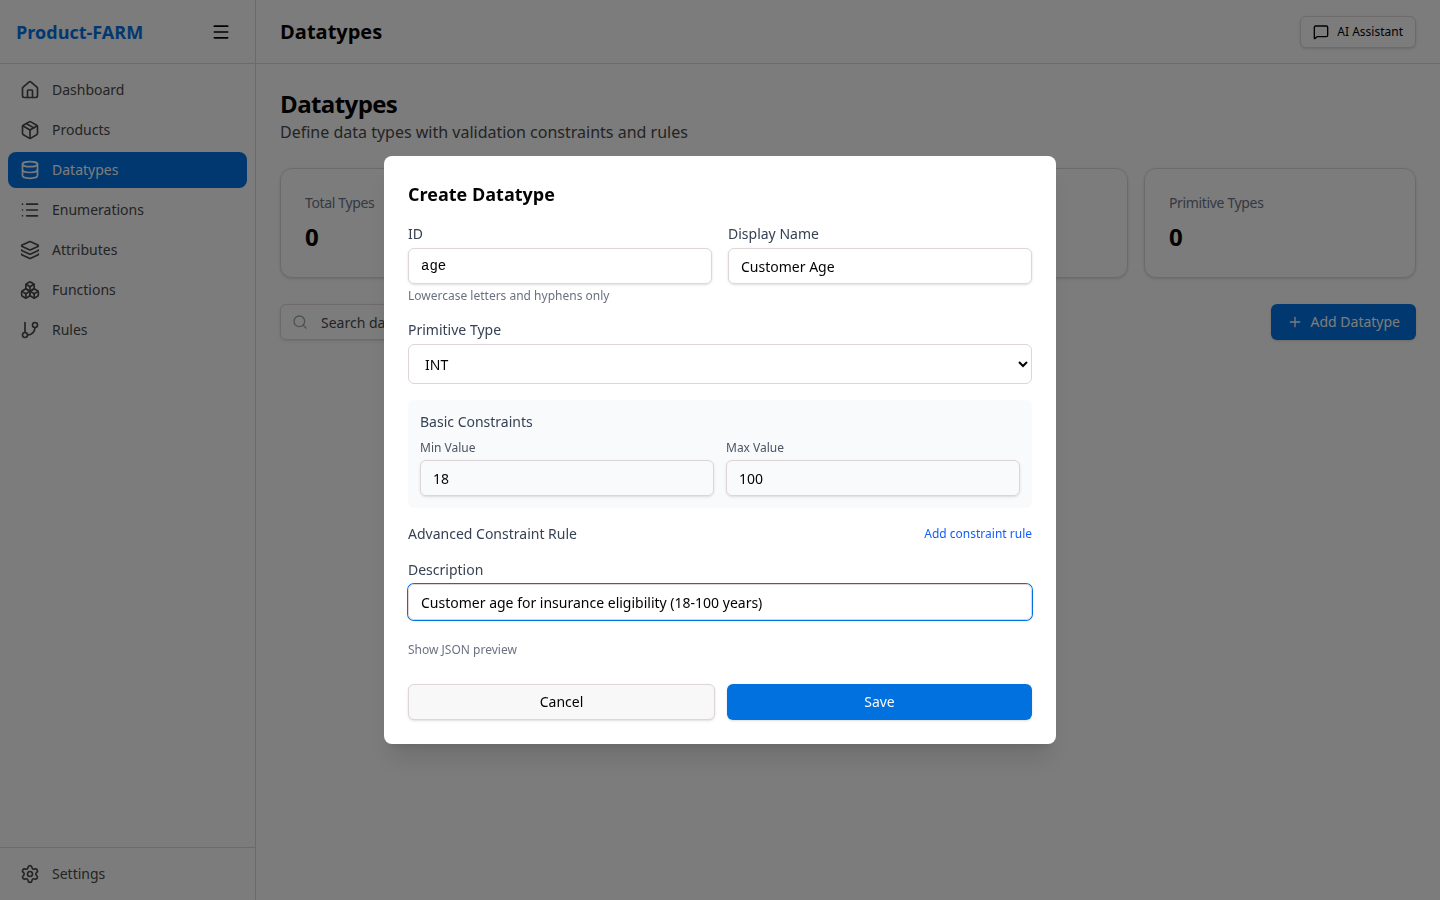
- Name:
currency - Base Type: Select
decimalfrom the dropdown - Description:
Monetary values with 2 decimal precision - Constraints: Set precision to 2 decimal places
2.3 View Your Datatypes
After creating datatypes, you’ll see them listed:
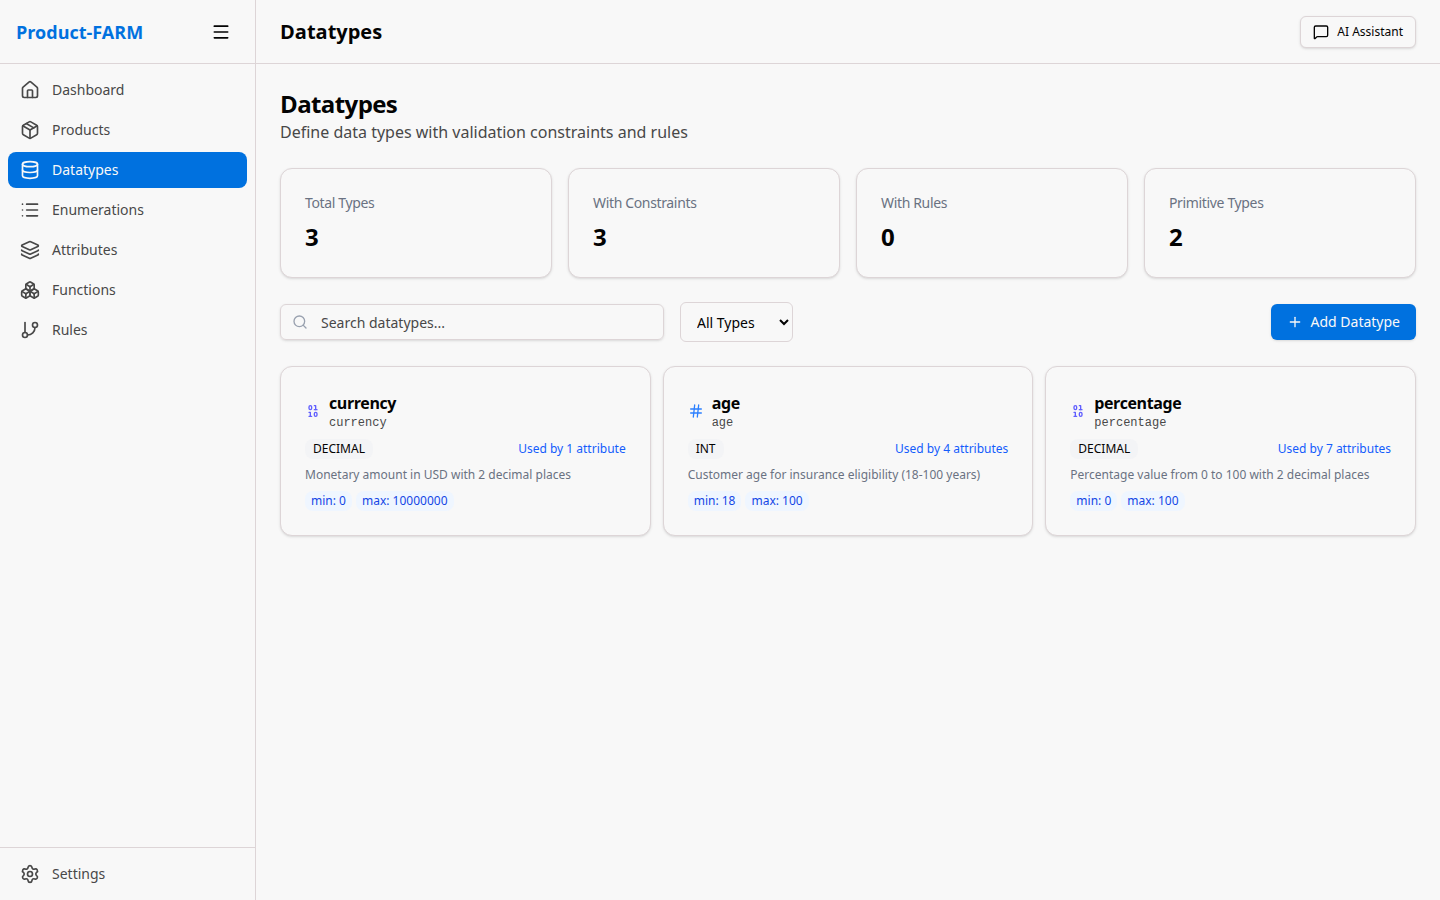
Create these datatypes for our example:
| Name | Base Type | Description |
|---|---|---|
currency |
decimal | Monetary values (2 decimal places) |
percentage |
decimal | Percentage values (0-100) |
age |
integer | Customer age (0-150) |
Part 3: Create Enumerations
Enumerations define fixed sets of values for categorical data.
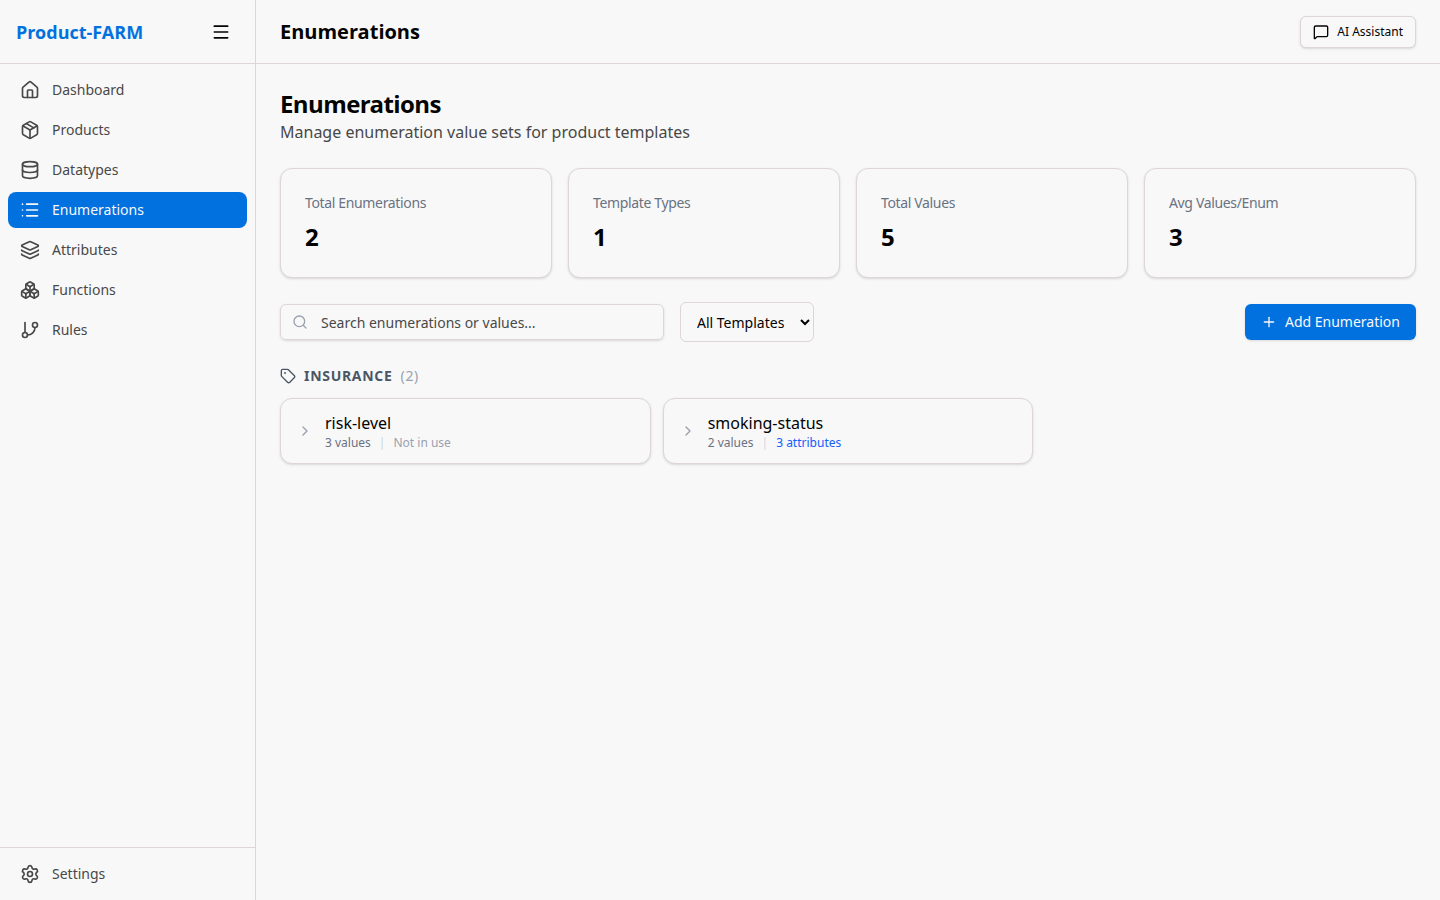
3.1 Navigate to Enumerations
Click “Enumerations” in the sidebar:
3.2 Create a Risk Level Enumeration
Click ”+ New Enumeration” to create categorical values:
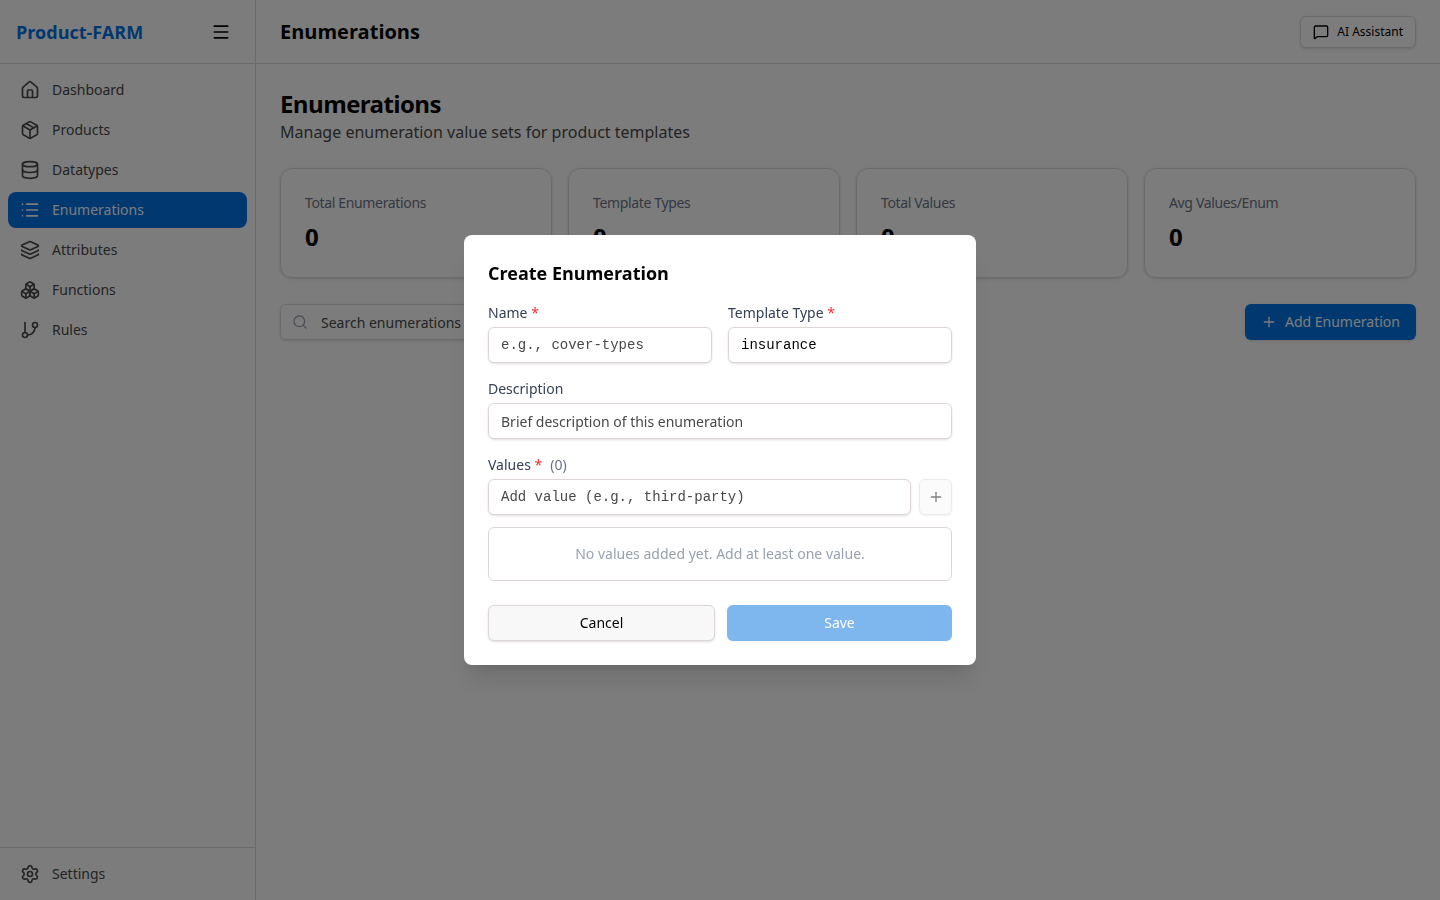
Fill in the risk level enumeration:
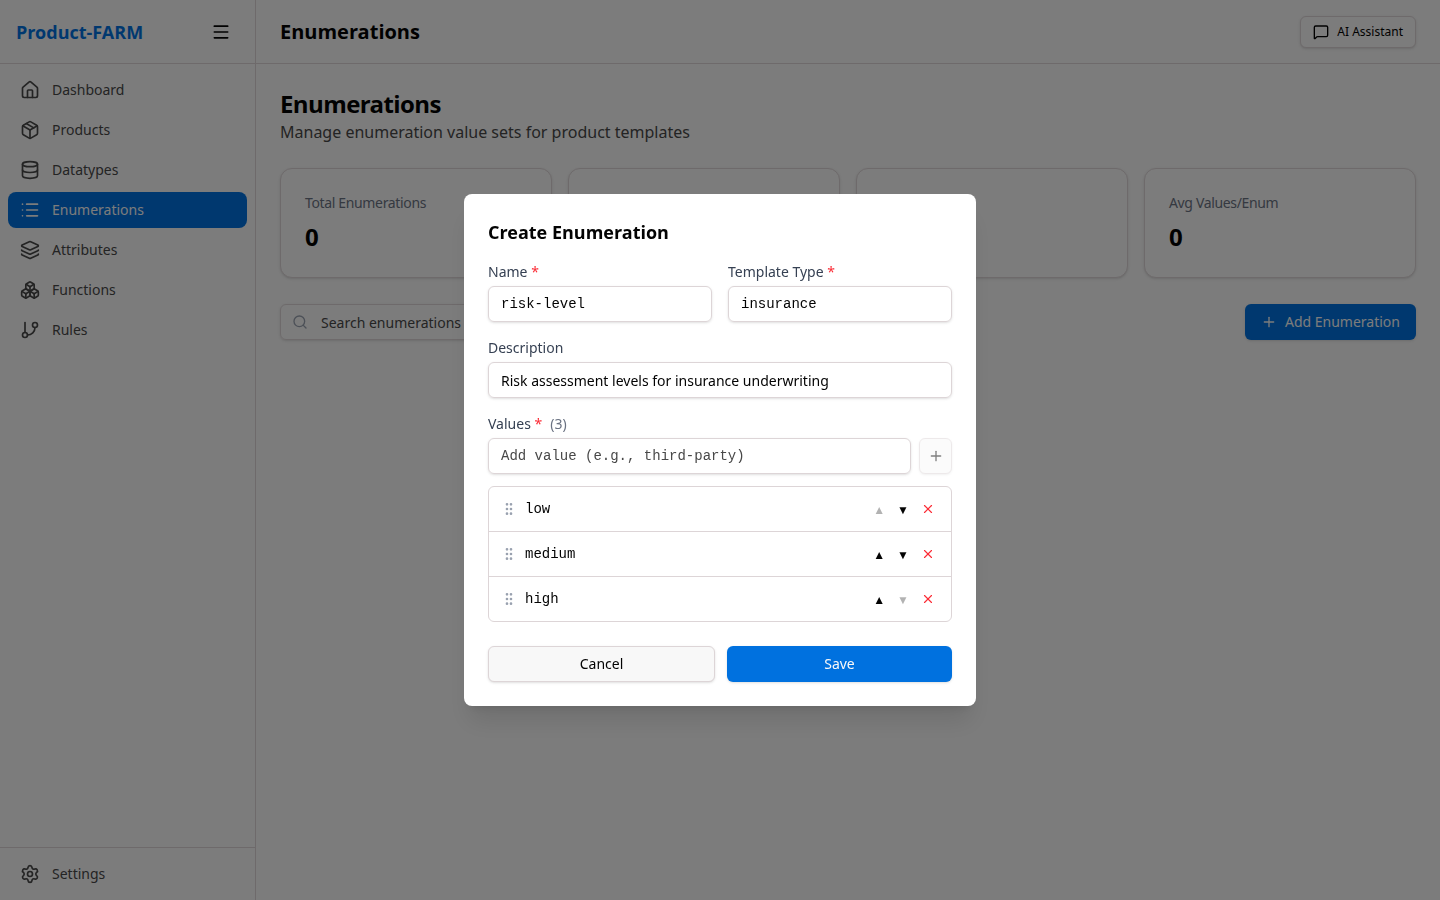
- Name:
risk_level - Values:
LOW,MEDIUM,HIGH,CRITICAL - Description:
Customer risk classification levels
3.3 View Your Enumerations

Create these enumerations for our example:
| Name | Values | Description |
|---|---|---|
risk_level |
LOW, MEDIUM, HIGH, CRITICAL | Risk classification |
policy_type |
BASIC, STANDARD, PREMIUM | Policy tier levels |
smoker_status |
NON_SMOKER, OCCASIONAL, REGULAR | Smoking status |
Part 4: Create a Product
Products are containers that hold all your business logic components.
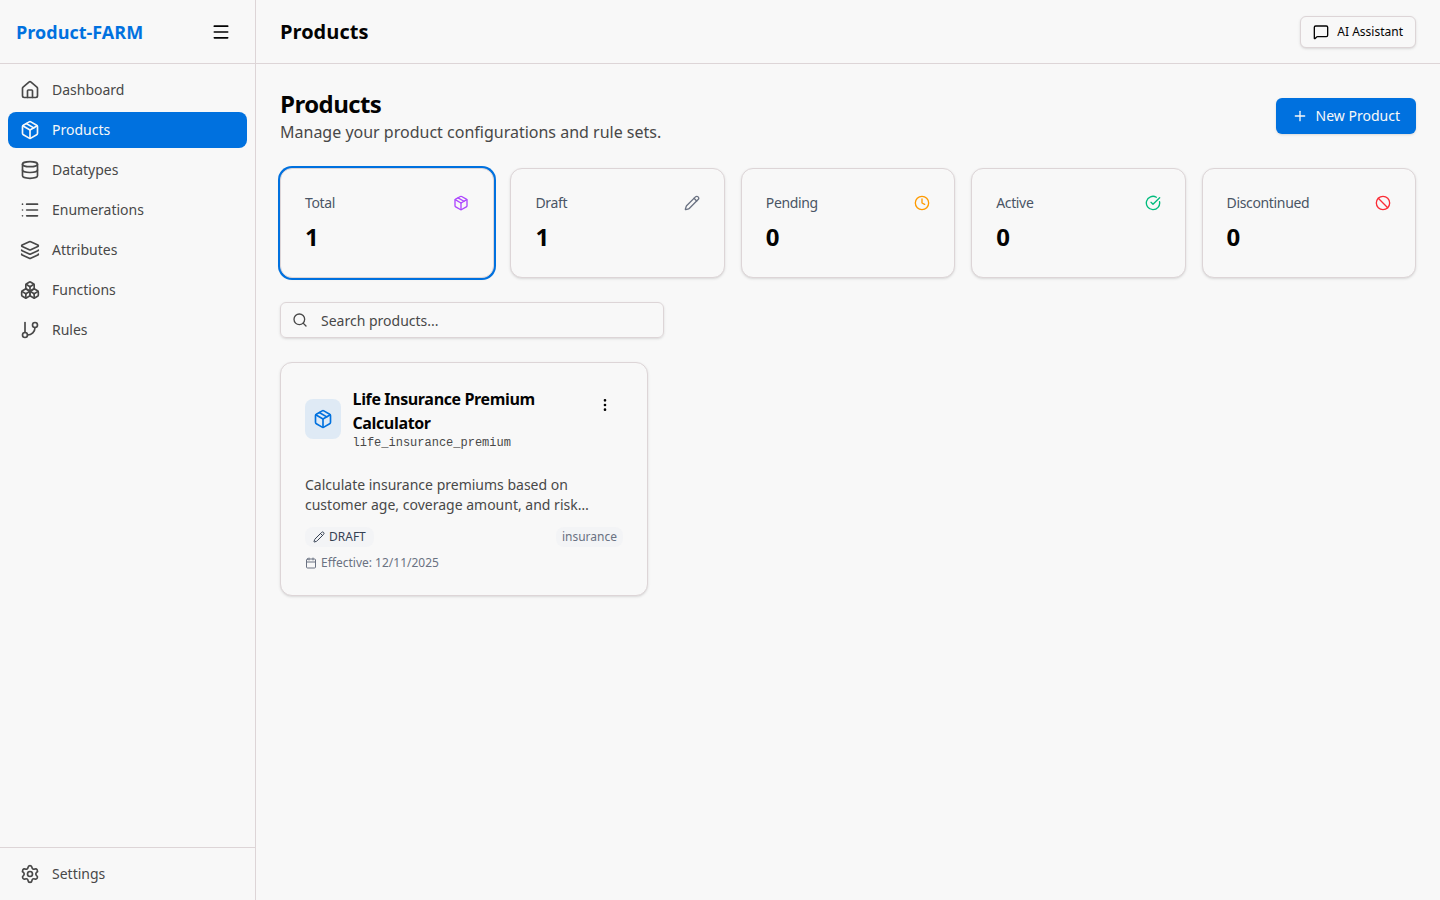
4.1 Navigate to Products
Click “Products” in the sidebar:
4.2 Create New Product
Click ”+ New Product” to open the creation dialog:
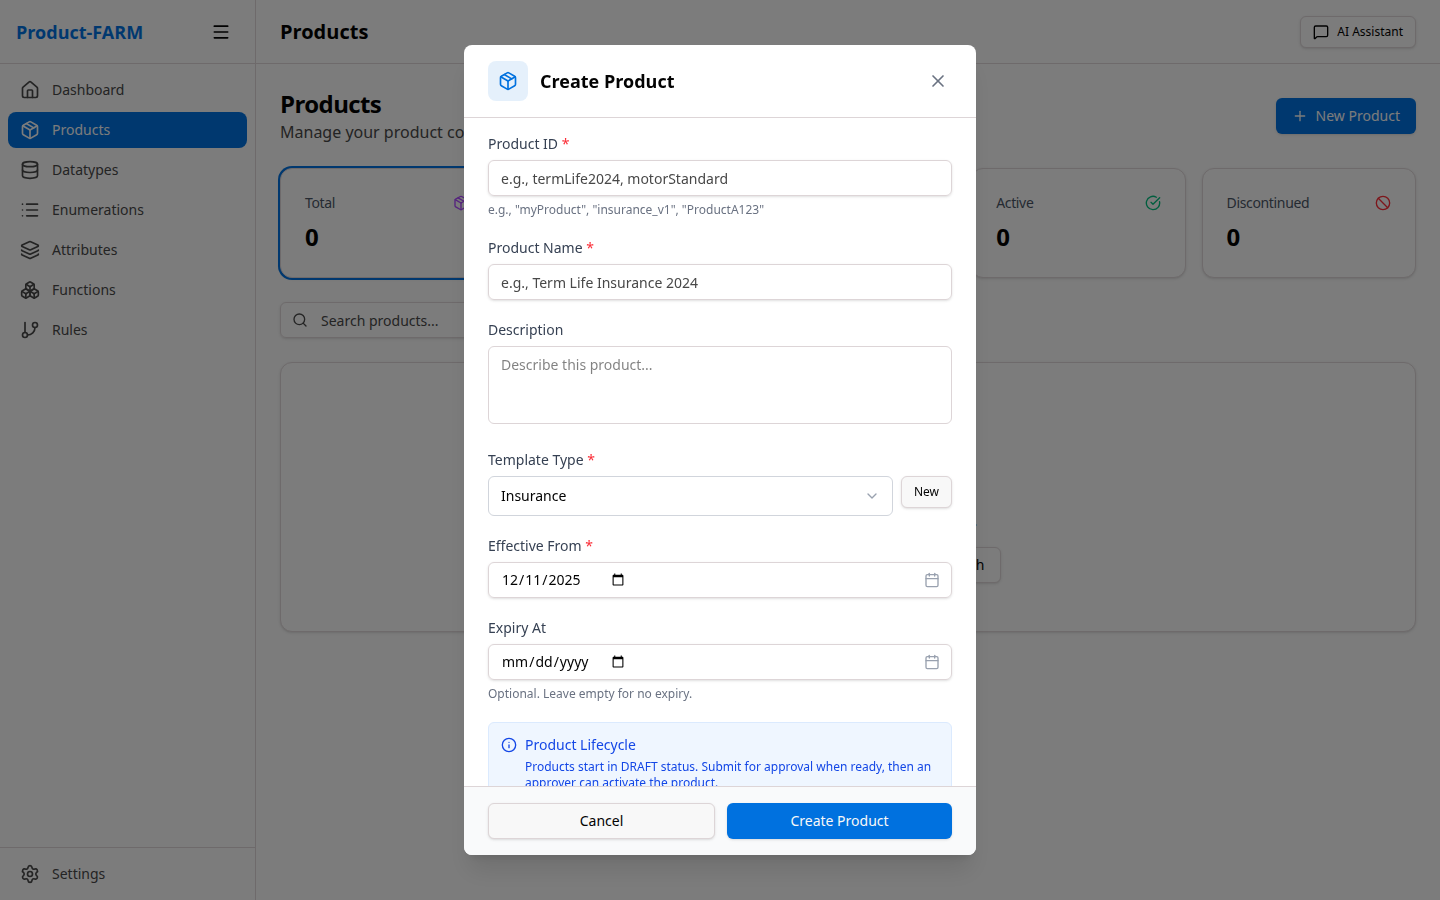
Fill in:
- Product ID:
insurance-premium-v1 - Name:
Insurance Premium Calculator - Description:
Calculate insurance premiums based on customer risk factors
4.3 View Product Details
After creation, click on the product to see its detail view:
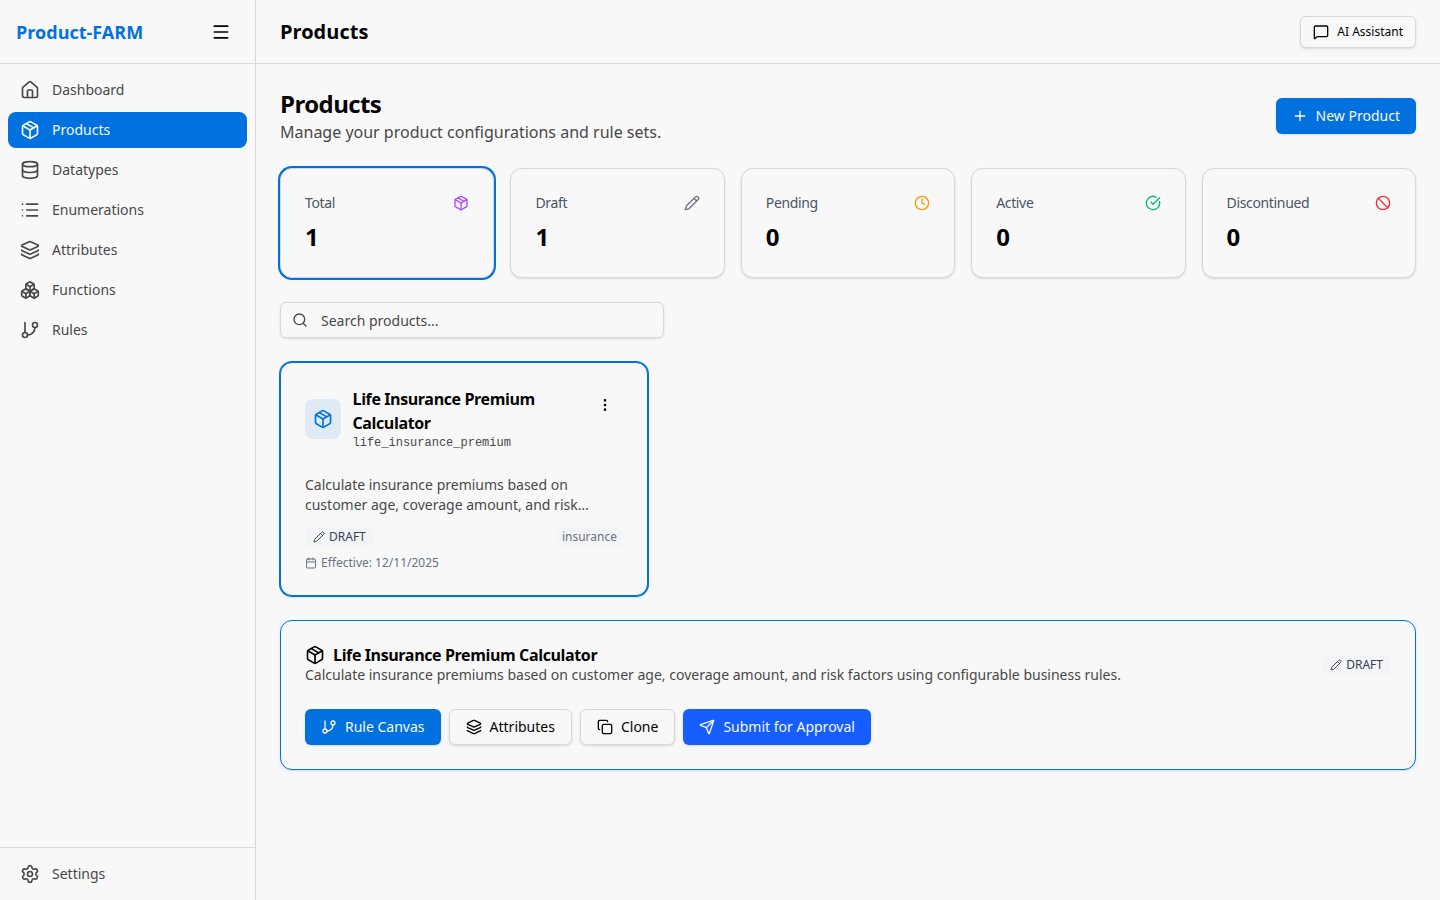
From here you can navigate to:
- Attributes: Define input/output variables
- Rules Canvas: Create and visualize rules
- Components: Manage product components
Part 5: Create Abstract Attributes
Attributes are the variables used in your rules - inputs, outputs, and calculated values.
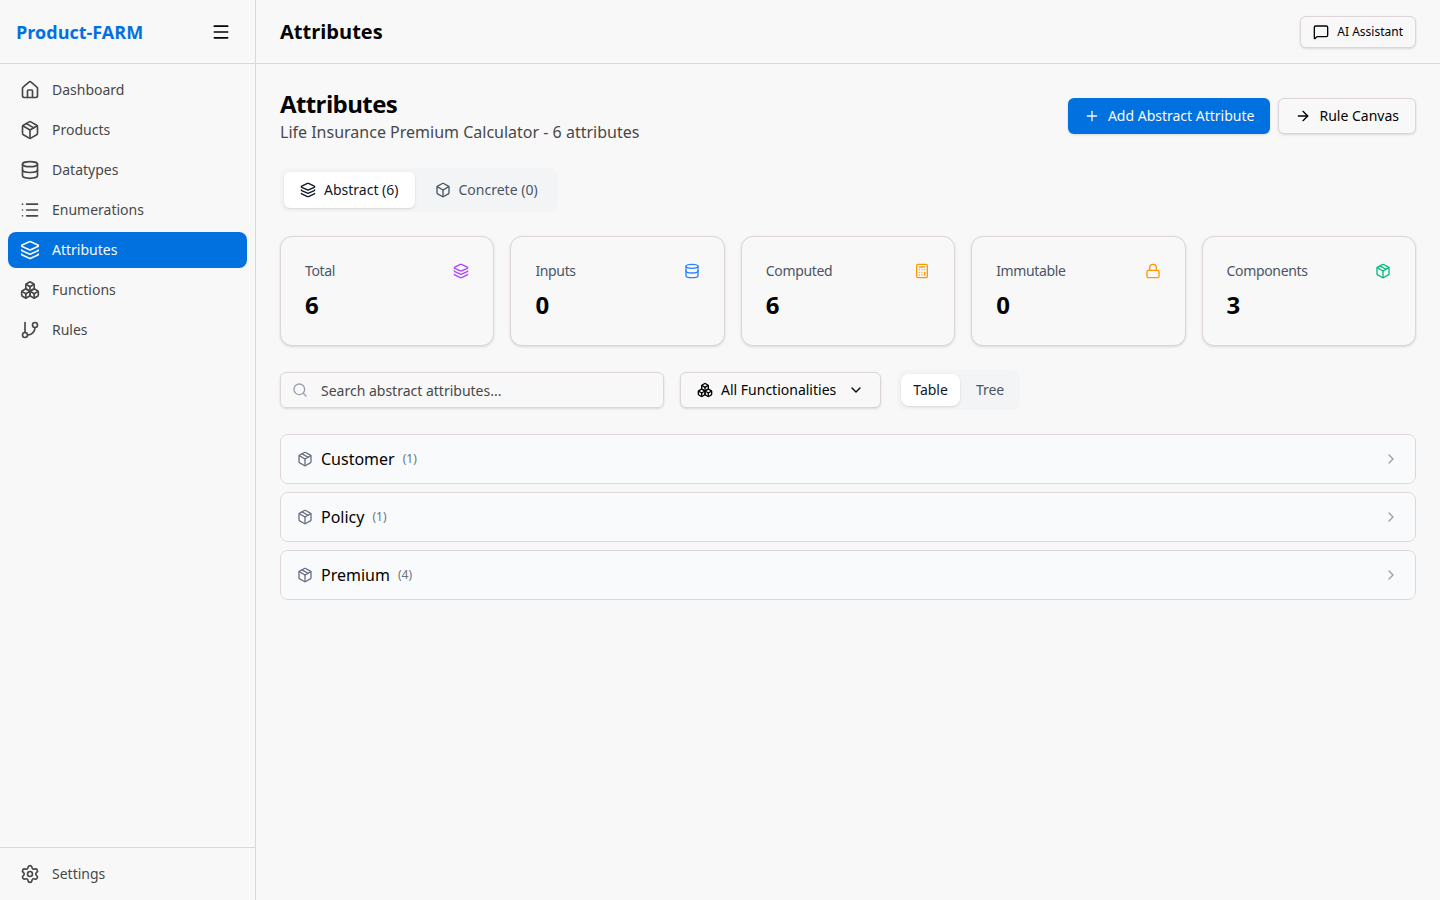
5.1 Navigate to Attributes
Click “Abstract Attributes” in the sidebar:
5.2 Create Input Attributes
Click ”+ New Attribute” to create an attribute:
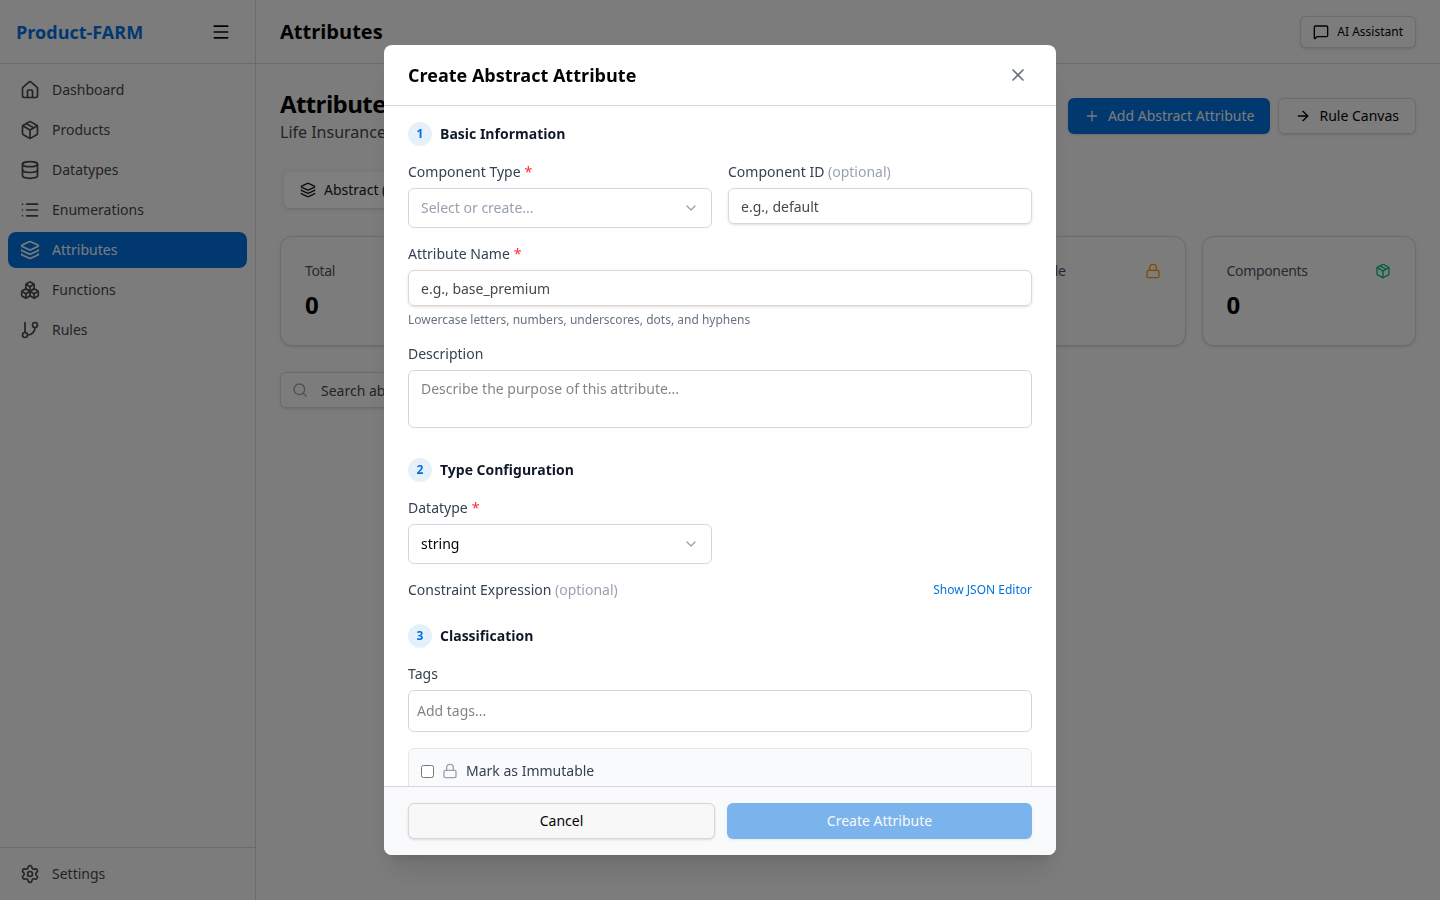
First, select the component type:
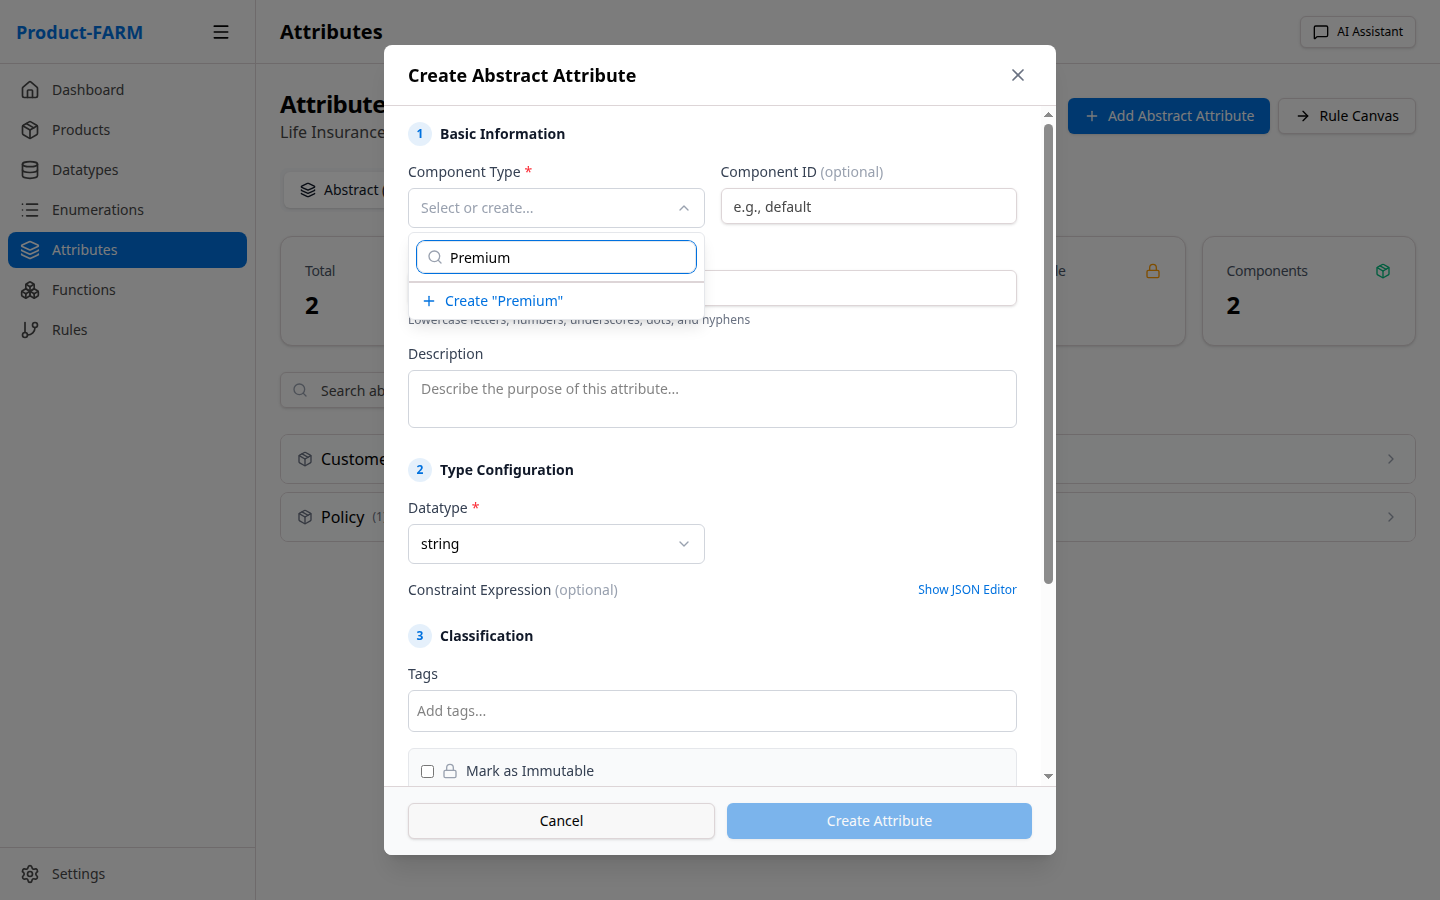
Then select the datatype:
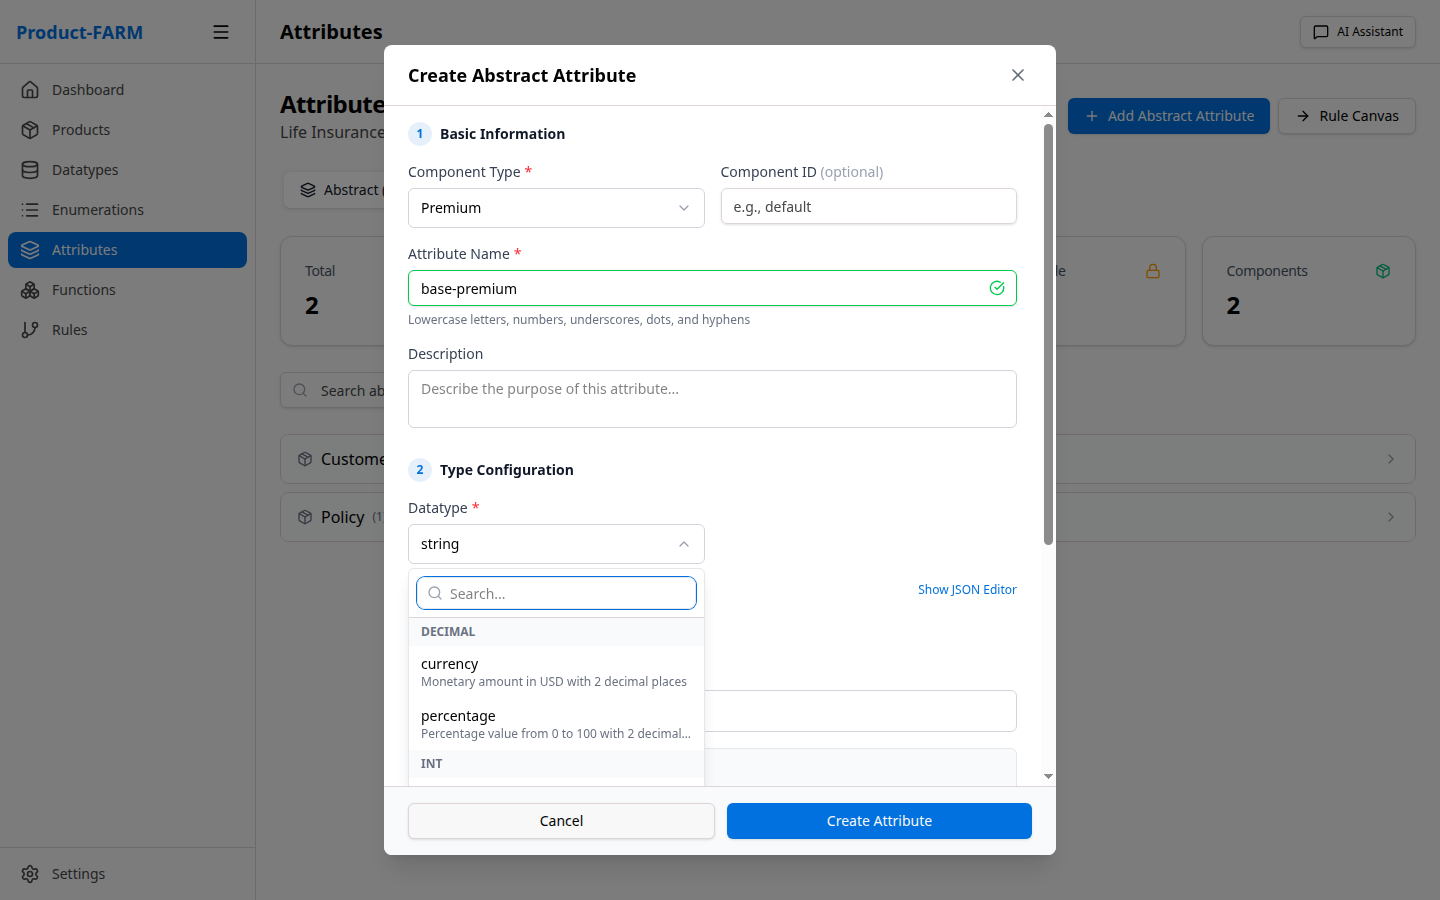
Fill in the attribute details:
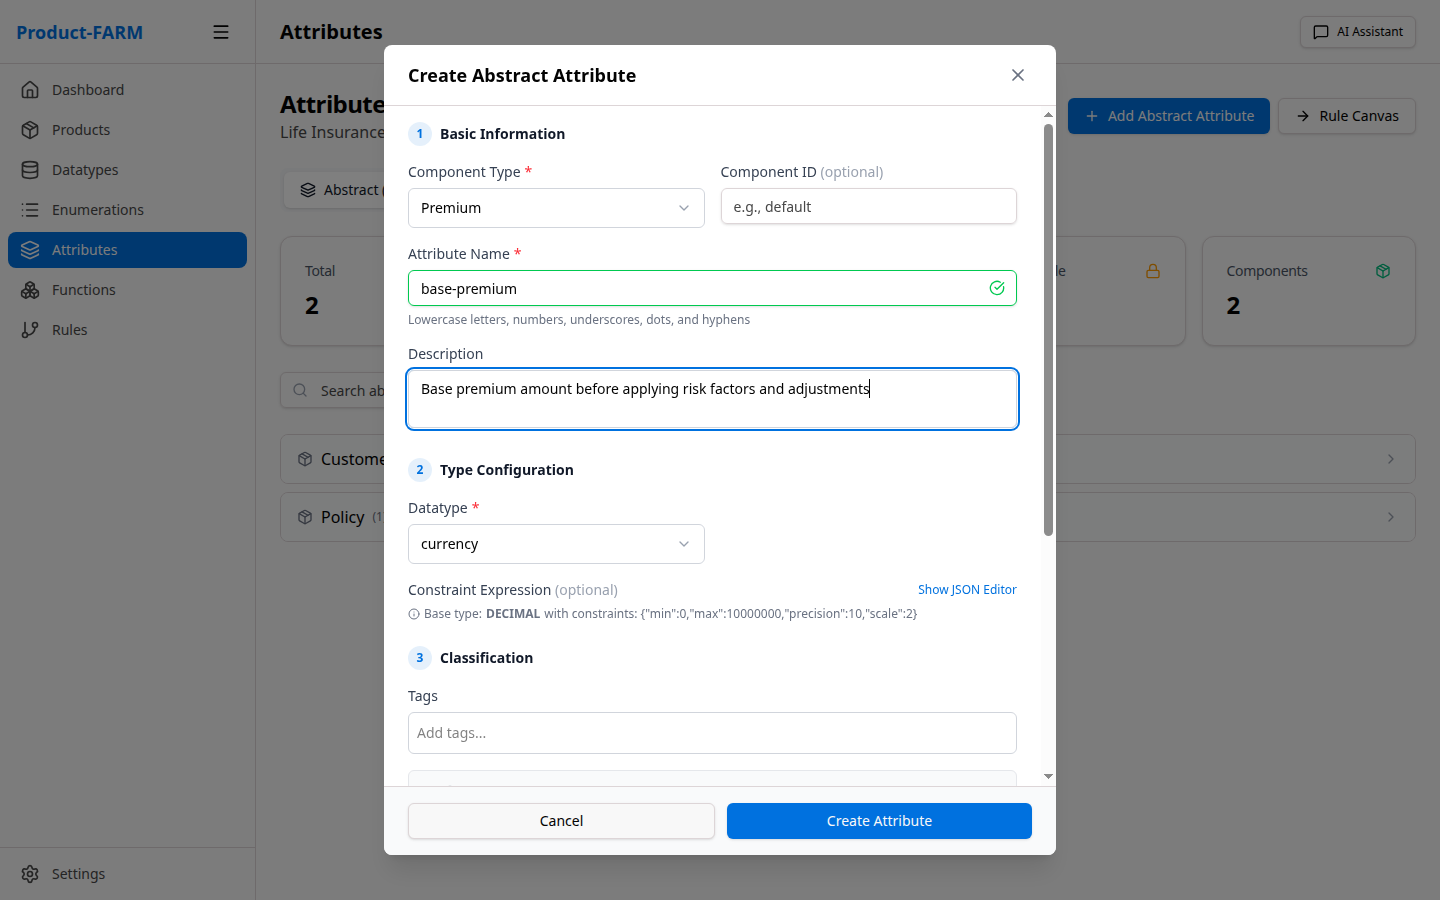
5.3 Create All Required Attributes
Create these attributes for the insurance calculator:
Input Attributes:
| Name | Component | Datatype | Description |
|---|---|---|---|
customer_age |
loan | age | Customer’s age in years |
coverage_amount |
loan | currency | Total coverage amount |
smoker_status |
loan | smoker_status | Customer smoking status |
policy_type |
loan | policy_type | Selected policy tier |
Calculated Attributes:
| Name | Component | Datatype | Description |
|---|---|---|---|
base_premium |
loan | currency | Base premium before factors |
age_factor |
loan | percentage | Age-based multiplier |
smoker_factor |
loan | percentage | Smoking-based multiplier |
risk_level |
loan | risk_level | Calculated risk classification |
Output Attributes:
| Name | Component | Datatype | Description |
|---|---|---|---|
final_premium |
loan | currency | Final calculated premium |
monthly_payment |
loan | currency | Monthly payment amount |
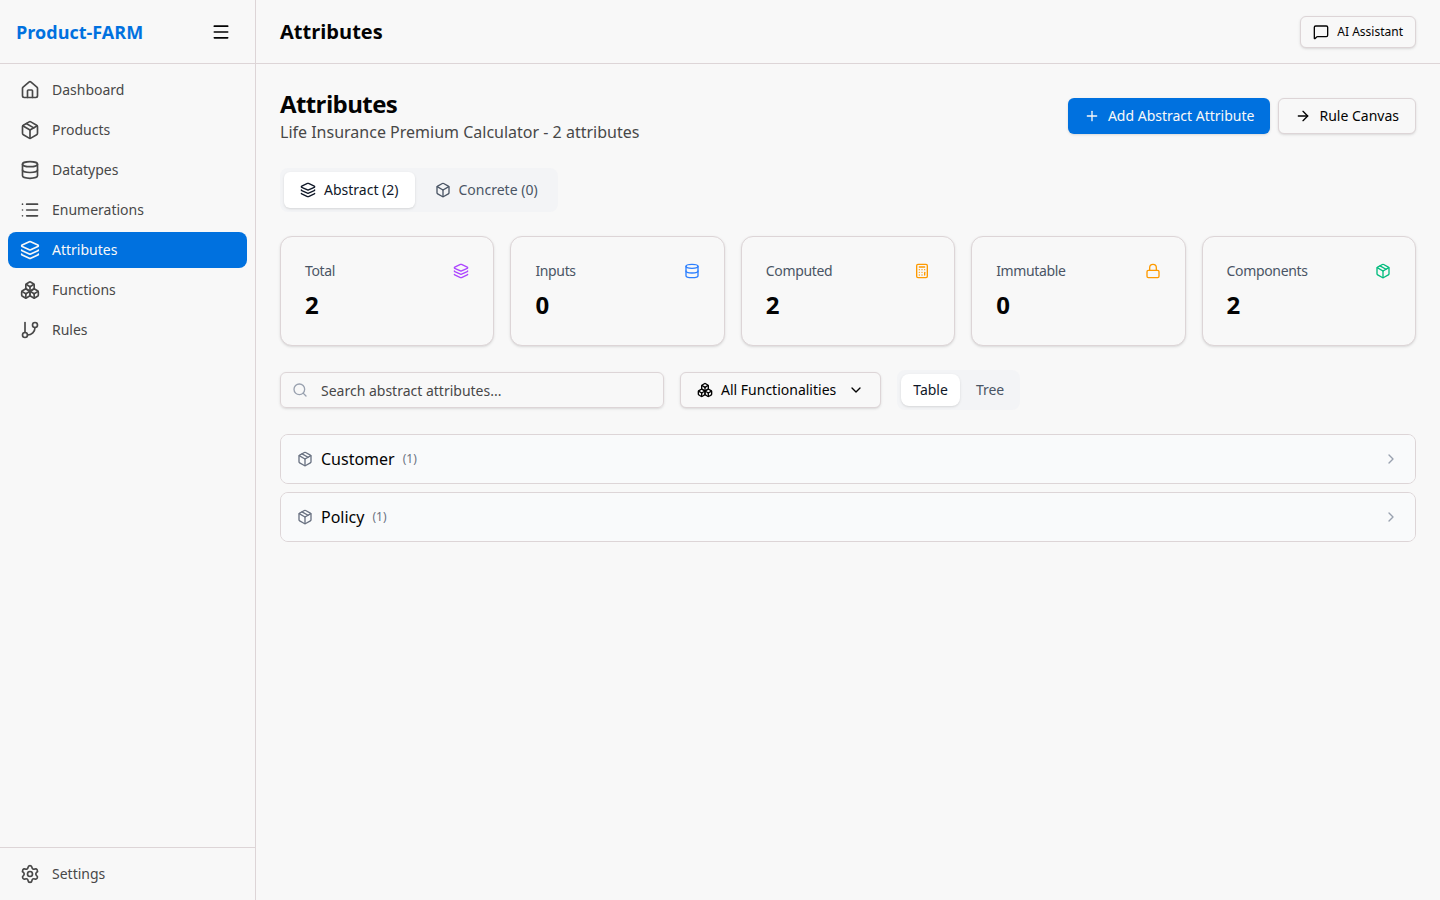
5.4 View All Attributes
After creating all attributes, your list should look like this:
Part 6: Create Rules
Rules define the business logic that transforms inputs into outputs.
6.1 Navigate to Rules Canvas
Click “Rules” in the sidebar to access the visual rule builder:
6.2 Create a New Rule
Click ”+ New Rule” to open the rule builder dialog:
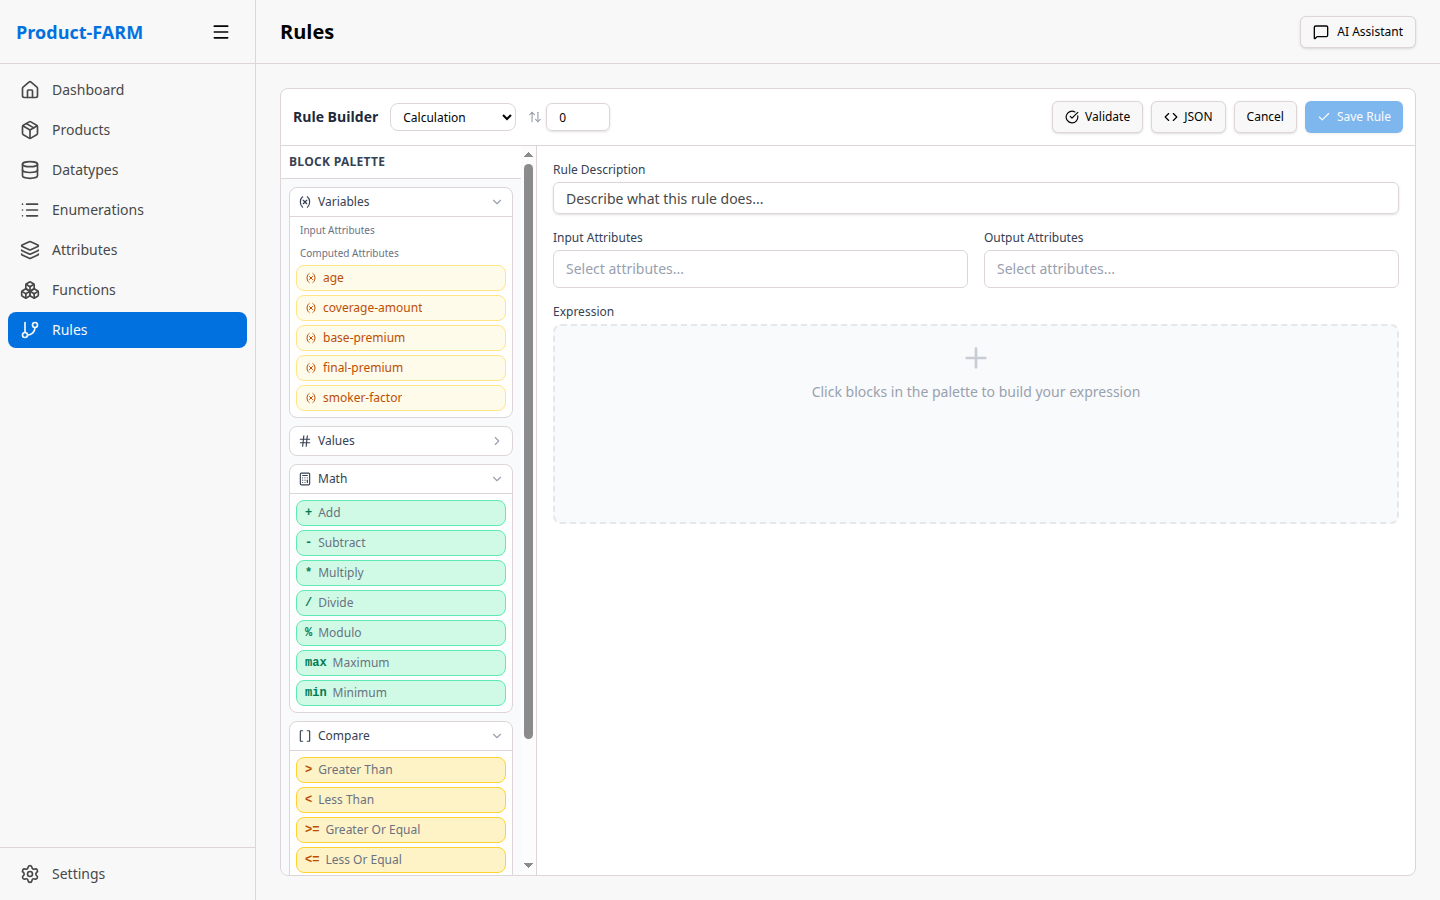
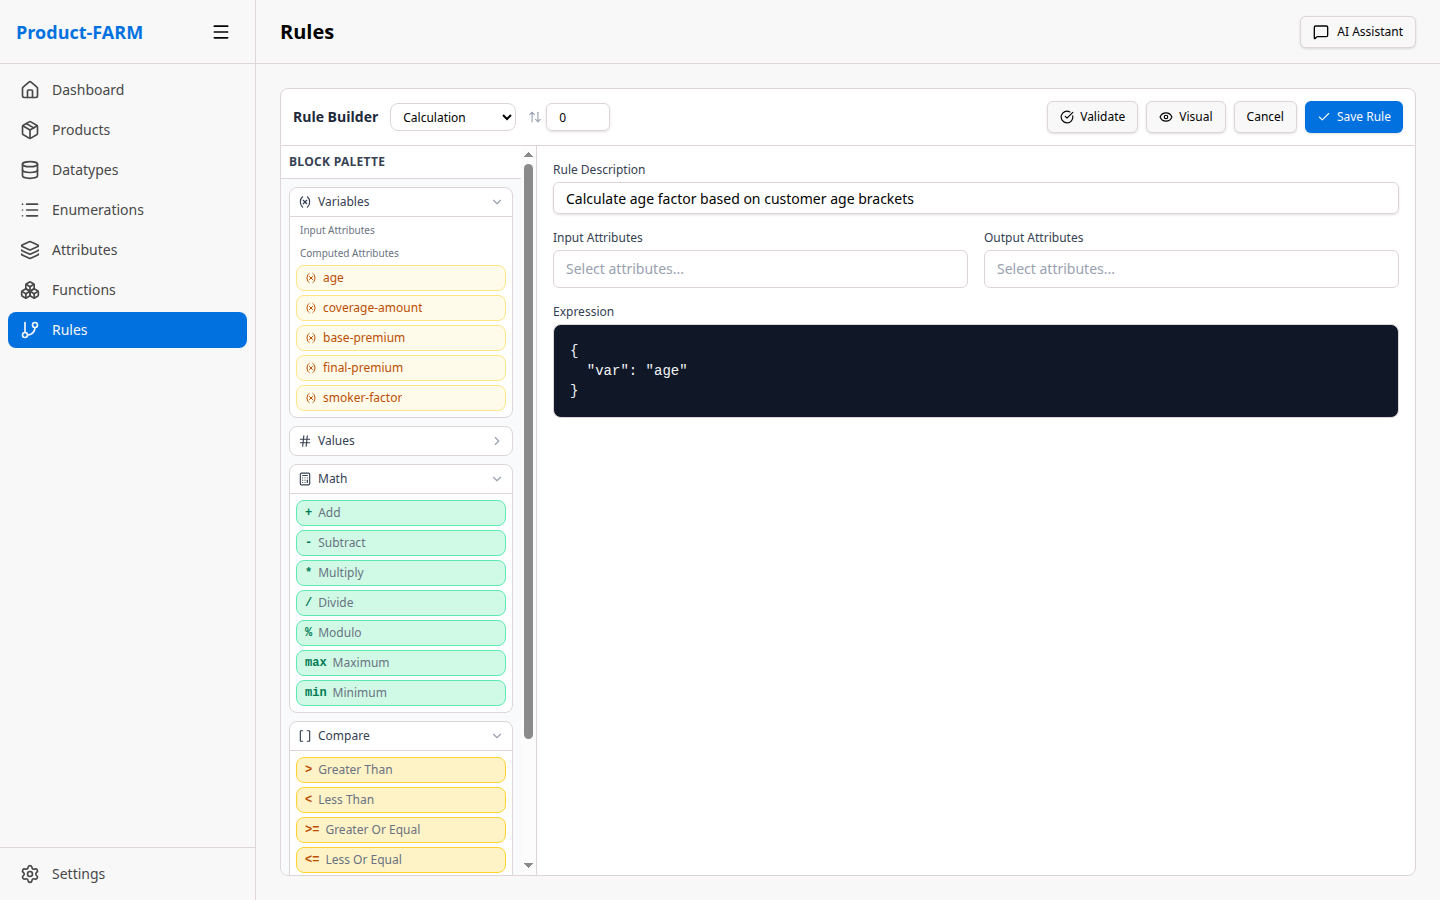
6.3 Build Rule Expression
Use the visual expression builder to create your rule logic:
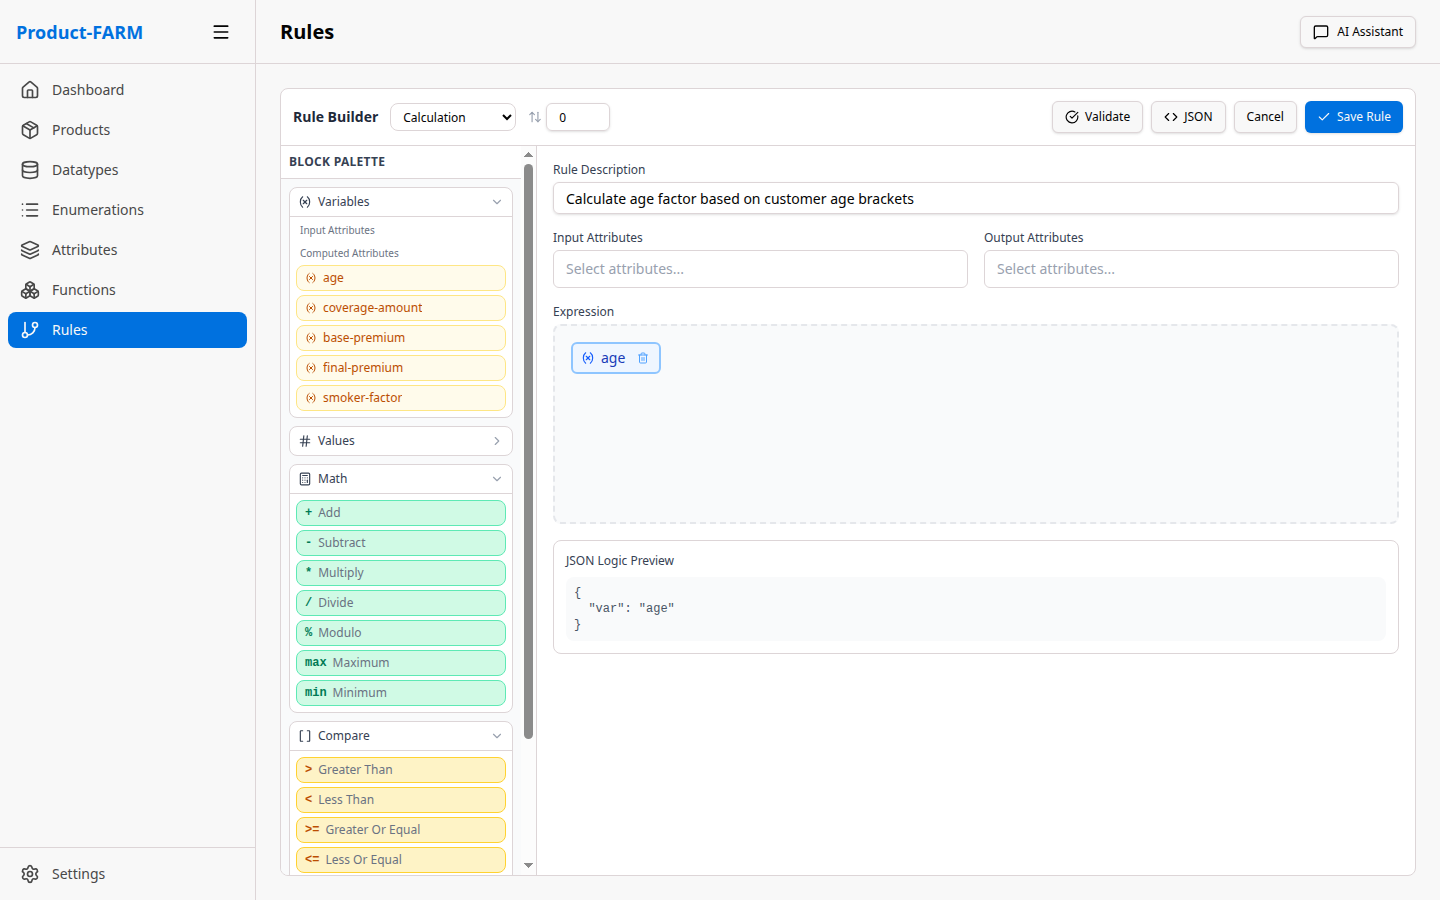
Or switch to JSON mode for complex expressions:
6.4 Create All Rules
Create these rules for the insurance calculator:
Rule 1: Base Premium Calculation
{
  "name": "calculate_base_premium",
  "rule_type": "CALCULATION",
  "display_expression": "base_premium = coverage_amount * 0.02",
  "expression": {
    "*": [{"var": "coverage_amount"}, 0.02]
  },
  "inputs": ["coverage_amount"],
  "outputs": ["base_premium"]
}
Rule 2: Age Factor
{
  "name": "calculate_age_factor",
  "rule_type": "CALCULATION",
  "display_expression": "age_factor = IF age > 60 THEN 1.5 ELSE IF age > 40 THEN 1.2 ELSE 1.0",
  "expression": {
    "if": [
      {">": [{"var": "customer_age"}, 60]}, 1.5,
      {">": [{"var": "customer_age"}, 40]}, 1.2,
      1.0
    ]
  },
  "inputs": ["customer_age"],
  "outputs": ["age_factor"]
}
Rule 3: Smoker Factor
{
  "name": "calculate_smoker_factor",
  "rule_type": "CALCULATION",
  "display_expression": "smoker_factor = CASE smoker_status WHEN REGULAR 1.8 WHEN OCCASIONAL 1.3 ELSE 1.0",
  "expression": {
    "if": [
      {"==": [{"var": "smoker_status"}, "REGULAR"]}, 1.8,
      {"==": [{"var": "smoker_status"}, "OCCASIONAL"]}, 1.3,
      1.0
    ]
  },
  "inputs": ["smoker_status"],
  "outputs": ["smoker_factor"]
}
Rule 4: Risk Level Classification
{
  "name": "classify_risk_level",
  "rule_type": "CLASSIFICATION",
  "display_expression": "risk_level = CLASSIFY based on age and smoker status",
  "expression": {
    "if": [
      {"and": [{">": [{"var": "customer_age"}, 60]}, {"==": [{"var": "smoker_status"}, "REGULAR"]}]}, "CRITICAL",
      {"or": [{">": [{"var": "customer_age"}, 60]}, {"==": [{"var": "smoker_status"}, "REGULAR"]}]}, "HIGH",
      {"or": [{">": [{"var": "customer_age"}, 40]}, {"==": [{"var": "smoker_status"}, "OCCASIONAL"]}]}, "MEDIUM",
      "LOW"
    ]
  },
  "inputs": ["customer_age", "smoker_status"],
  "outputs": ["risk_level"]
}
Rule 5: Final Premium Calculation
{
  "name": "calculate_final_premium",
  "rule_type": "CALCULATION",
  "display_expression": "final_premium = base_premium * age_factor * smoker_factor",
  "expression": {
    "*": [
      {"var": "base_premium"},
      {"var": "age_factor"},
      {"var": "smoker_factor"}
    ]
  },
  "inputs": ["base_premium", "age_factor", "smoker_factor"],
  "outputs": ["final_premium"]
}
Rule 6: Monthly Payment
{
  "name": "calculate_monthly_payment",
  "rule_type": "CALCULATION",
  "display_expression": "monthly_payment = final_premium / 12",
  "expression": {
    "/": [{"var": "final_premium"}, 12]
  },
  "inputs": ["final_premium"],
  "outputs": ["monthly_payment"]
}
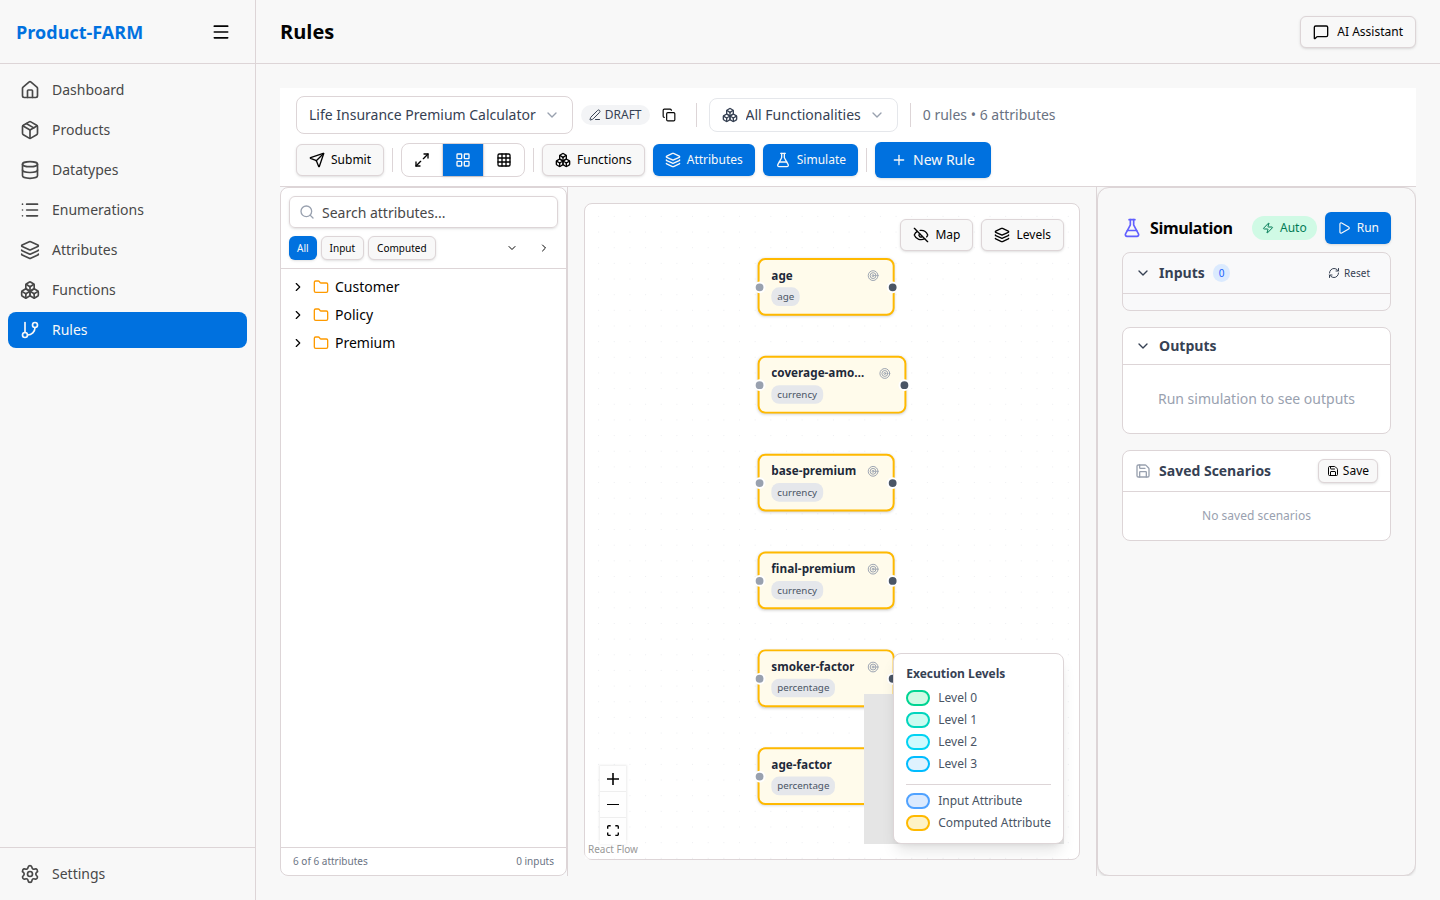
6.5 View Rules in Canvas
After creating rules, the canvas shows them with dependencies:
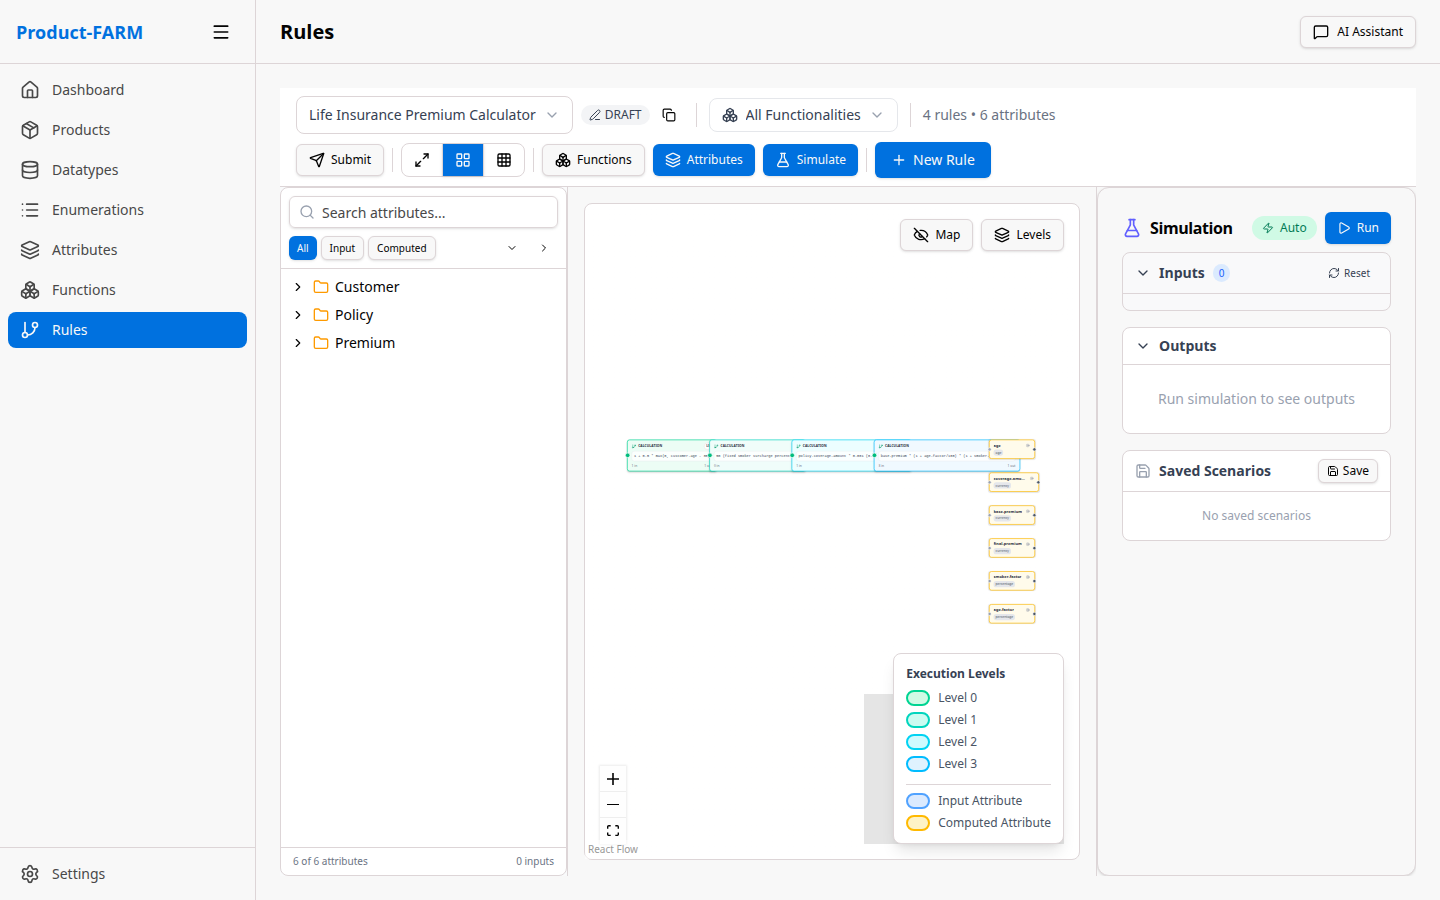
Part 7: Visualize the Rule DAG
The DAG (Directed Acyclic Graph) visualization shows how rules depend on each other and execute in parallel.
7.1 View Full DAG
Click “View DAG” or expand the canvas to see the full dependency graph:
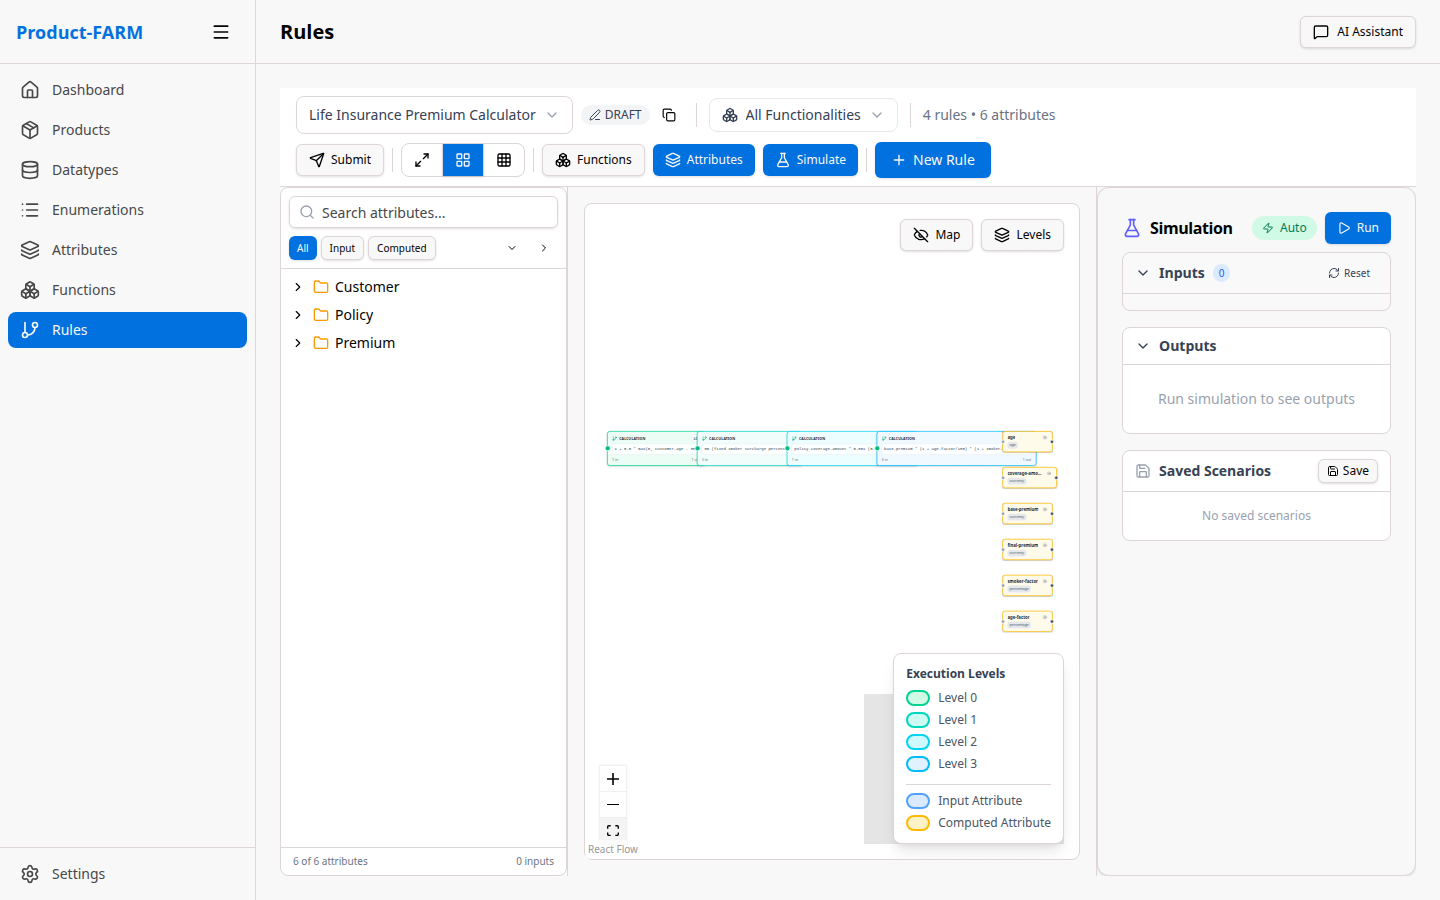
The DAG shows:
- Input nodes (green): Where data enters the system
- Rule nodes (blue): Processing logic
- Output nodes (purple): Final calculated values
- Dependency arrows: Data flow between rules
7.2 Understanding Parallel Execution
Rules at the same level execute in parallel:
flowchart TB
    subgraph L0["⚡ Level 0 - Parallel Execution"]
        direction LR
        R1["calculate_base_premium<br/><small>inputs: coverage_amount</small>"]
        R2["calculate_age_factor<br/><small>inputs: customer_age</small>"]
        R3["calculate_smoker_factor<br/><small>inputs: smoker_status</small>"]
        R4["classify_risk_level<br/><small>inputs: customer_age, smoker_status</small>"]
    end

    subgraph L1["🔗 Level 1 - After Level 0"]
        R5["calculate_final_premium<br/><small>inputs: base_premium, age_factor, smoker_factor</small>"]
    end

    subgraph L2["🔗 Level 2 - After Level 1"]
        R6["calculate_monthly_payment<br/><small>inputs: final_premium</small>"]
    end

    R1 --> R5
    R2 --> R5
    R3 --> R5
    R5 --> R6

    style L0 fill:#065f46,stroke:#10b981,color:#fff
    style L1 fill:#1e3a5f,stroke:#3b82f6,color:#fff
    style L2 fill:#4c1d95,stroke:#8b5cf6,color:#fff
Part 8: Test Your Product
8.1 Using the Simulation Panel
Click “Simulate” to test your rules with sample data:
{
  "customer_age": 55,
  "coverage_amount": 500000,
  "smoker_status": "OCCASIONAL",
  "policy_type": "STANDARD"
}
Expected Output:
{
  "base_premium": 10000.00,
  "age_factor": 1.2,
  "smoker_factor": 1.3,
  "risk_level": "MEDIUM",
  "final_premium": 15600.00,
  "monthly_payment": 1300.00
}
8.2 Using the REST API
# Evaluate the product
curl -X POST http://localhost:8081/api/products/insurance-premium-v1/evaluate \
  -H "Content-Type: application/json" \
  -d '{
    "inputs": {
      "customer_age": 55,
      "coverage_amount": 500000,
      "smoker_status": "OCCASIONAL",
      "policy_type": "STANDARD"
    }
  }'
8.3 Using the gRPC API
grpcurl -plaintext -d '{
  "product_id": "insurance-premium-v1",
  "input_data": {
    "customer_age": {"int_value": 55},
    "coverage_amount": {"decimal_value": "500000"},
    "smoker_status": {"string_value": "OCCASIONAL"}
  }
}' localhost:50051 product_farm.ProductFarmService/Evaluate
Stopping Services
To stop all services:
./stop-all.sh
Or manually:
pkill -f "product-farm-api"
pkill -f "vite"
pkill -f "dgraph"
Troubleshooting
Port Already in Use
# Find process using port
lsof -i :8081

# Kill the process
kill -9 <PID>
DGraph Not Starting
# Clear data and restart
rm -rf infrastructure/dgraph-data/*
./start-all.sh
Backend Build Errors
cd backend
cargo clean
cargo build
Frontend Dependencies
cd frontend
rm -rf node_modules
npm install
Next Steps
Congratulations! You’ve built a complete insurance premium calculator with:
- ✅ Custom datatypes and enumerations
- ✅ Input, calculated, and output attributes
- ✅ Multiple rules with dependencies
- ✅ Automatic parallel execution via DAG
Now explore more:
Understand the Product
- Why Product-FARM - Learn why this product was created
- Core Concepts - Deep dive into terminology and entities
Technical Deep-Dives
- How It Works - Understand rule evaluation internals
- Architecture Guide - System design and components
More Resources
- Use Cases - Real-world implementation examples
- Roadmap - Future features and vision
- API Reference - Complete API documentation